Did you know 74% of businesses experience operational disruptions due to unexpected shifts in consumer needs? Whether you’re launching a new product or scaling operations, understanding market dynamics isn’t optional—it’s survival. Take KFC’s 2018 U.K. crisis: a supply chain breakdown caused by demand surges led to 870 store closures in days. This real-world example shows how quickly price changes or stock shortages can destabilize even established brands.
Market demand analysis helps businesses anticipate trends, set competitive prices, and align production with real-world needs. It’s the difference between reacting to crises and building resilience. For instance, when demand decreases for a product, companies with agile strategies pivot quickly—like shifting ad budgets or adjusting inventory levels.
In this guide, we’ll explore how aggregate demand (total consumer interest) differs from individual preferences. You’ll learn actionable methods to balance supply and demand, backed by case studies and research. We’ve tailored this resource for professionals prioritizing stability in fast-moving industries.
Key Takeaways
- Accurate demand forecasting prevents costly overstocking or shortages.
- Pricing strategies directly influence consumer behavior and brand loyalty.
- Aggregate demand analysis reveals broader trends beyond individual cases.
- Real-time data helps businesses adapt to sudden supply chain shifts.
- Proactive planning turns market volatility into competitive advantages.
What is Market Demand?
What separates thriving businesses from struggling ones? Often, it’s their grasp of collective buyer behavior. Market demand represents the total amount of a specific product people will purchase across different price points within a defined timeframe. Unlike individual preferences, it combines purchasing power with actual buying patterns.
The Building Blocks of Consumer Needs
Three elements shape this critical metric:
- How many consumers want your product
- What prices they’re willing to pay
- How external factors like income levels affect decisions
« Understanding demand isn’t about predicting the future—it’s about preparing for multiple possibilities. »
Collective vs. Personal Choices
| Aspect | Market Demand | Individual Demand |
|---|---|---|
| Scope | Entire target audience | Single consumer |
| Key Influence | Average pricing trends | Personal budget |
| Business Impact | Production scale | Customized ads |
For example, while 68% of French households might buy eco-friendly cleaning products (market demand), one customer could prioritize scent over sustainability (individual choice). This distinction determines whether you stock 10,000 units or create personalized marketing campaigns.
To calculate accurate demand, ask:
- What percentage of your audience can afford current prices?
- How does seasonality affect purchase frequency?
- What competing products influence buying decisions?
These insights help balance inventory levels with targeted outreach—crucial for maintaining profit margins during supply chain disruptions.
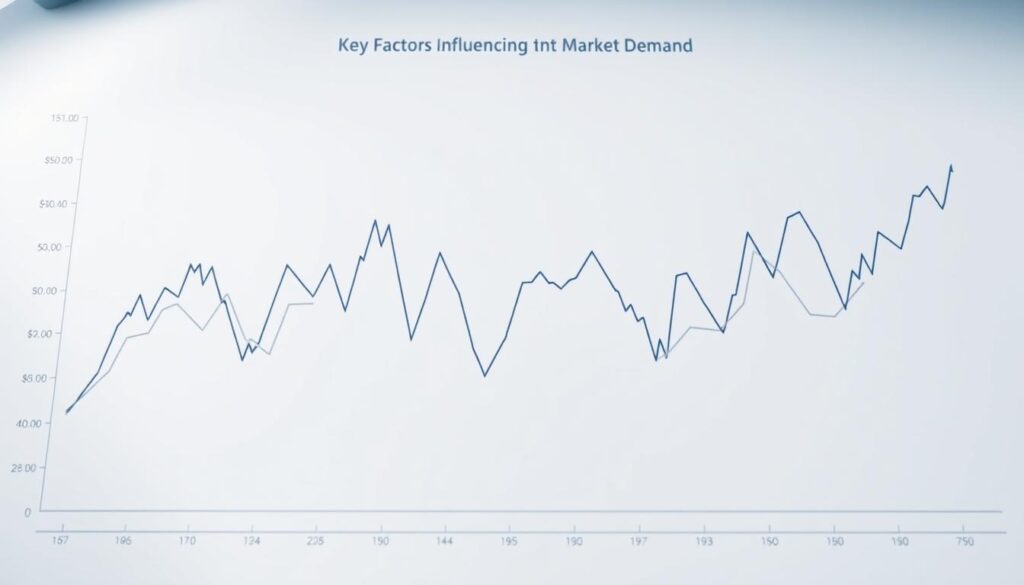
Key Factors Influencing Market Demand

Why do some products vanish from shelves while others linger? The answer lies in three interconnected forces shaping buyer behavior. Let’s break down how pricing strategies, income shifts, and competitor actions create ripple effects across industries.
Price Dynamics and Consumer Income
When smartphone brands cut prices by 15%, sales typically jump 22% within weeks. This inverse relationship between cost and quantity demanded forms the backbone of pricing strategy. Higher earnings amplify this effect—consumers with rising incomes often upgrade to premium versions of the same product.
Consider budget-friendly grocery chains during economic downturns. As household incomes shrink, their latent demand surges by 34% compared to luxury brands. This shift highlights why tracking wage trends helps businesses adjust stocks before competitors react.
Impact of Related Goods and Consumer Preferences
Electric vehicle sales doubled in France last year, partly due to rising fuel costs. When substitute goods like gasoline become expensive, alternatives gain traction. Complementary items follow similar logic—a 20% price drop in gaming consoles often boosts accessory sales by 18%.
Seasonal shifts reveal hidden opportunities. Ice cream shops near Paris beaches stock 40% more inventory in summer, while winter sees thermal wear supply chains accelerate. Social media trends add complexity—53% of Gen Z buyers now prioritize eco-friendly packaging, forcing brands to redesign product service models.
« Ignoring substitute goods is like driving with fogged windows—you’ll miss critical turns in consumer behavior. »
By mapping these variables, businesses can determine market responses before launching new lines. It’s not about predicting every shift, but building systems that adapt faster than rivals.
Techniques for Analyzing Market Demand
How do leading companies stay ahead of shifting buyer behavior? Modern analysis combines digital tools with human insights to decode patterns. Three proven methods deliver actionable results when used together.
Leveraging Keyword Research Tools
Start with SEO tools like Google Keyword Planner. Track monthly search volumes for terms like « biodegradable packaging » to gauge product ideas. For example, a French cosmetics brand discovered 12,000+ monthly searches for « vegan hair care, » guiding their new product launches.
| Tool | Key Feature | Best For |
|---|---|---|
| Keyword Surfer | Real-time volume data | Content gaps |
| Google Trends | Seasonal spikes | Inventory planning |
| SEMrush | Competitor analysis | Pricing strategies |
Utilizing Social Listening and Data Analytics
Platforms like Brandwatch track social media sentiment. When Parisian cafés noticed 23% more complaints about « slow service, » they optimized staff schedules. Combine this with web analytics to identify customers’ pain points.
« Social data reveals what people won’t tell surveys—their raw, unfiltered priorities. »
Integrating Industry Reports and Trends
Cross-reference internal data with reports from INSEE or Xerfi. A Lyon-based retailer used sector forecasts to align supply chains with predicted 18% growth in eco-friendly textiles. Always validate findings through A/B testing before full implementation.
- Set up automated alerts for competitor price changes
- Compare search trends with sales data weekly
- Host monthly team reviews of consumer feedback
This multi-source approach helps businesses make informed decisions without guesswork. Balance numbers with real conversations to understand consumers’ unspoken needs.
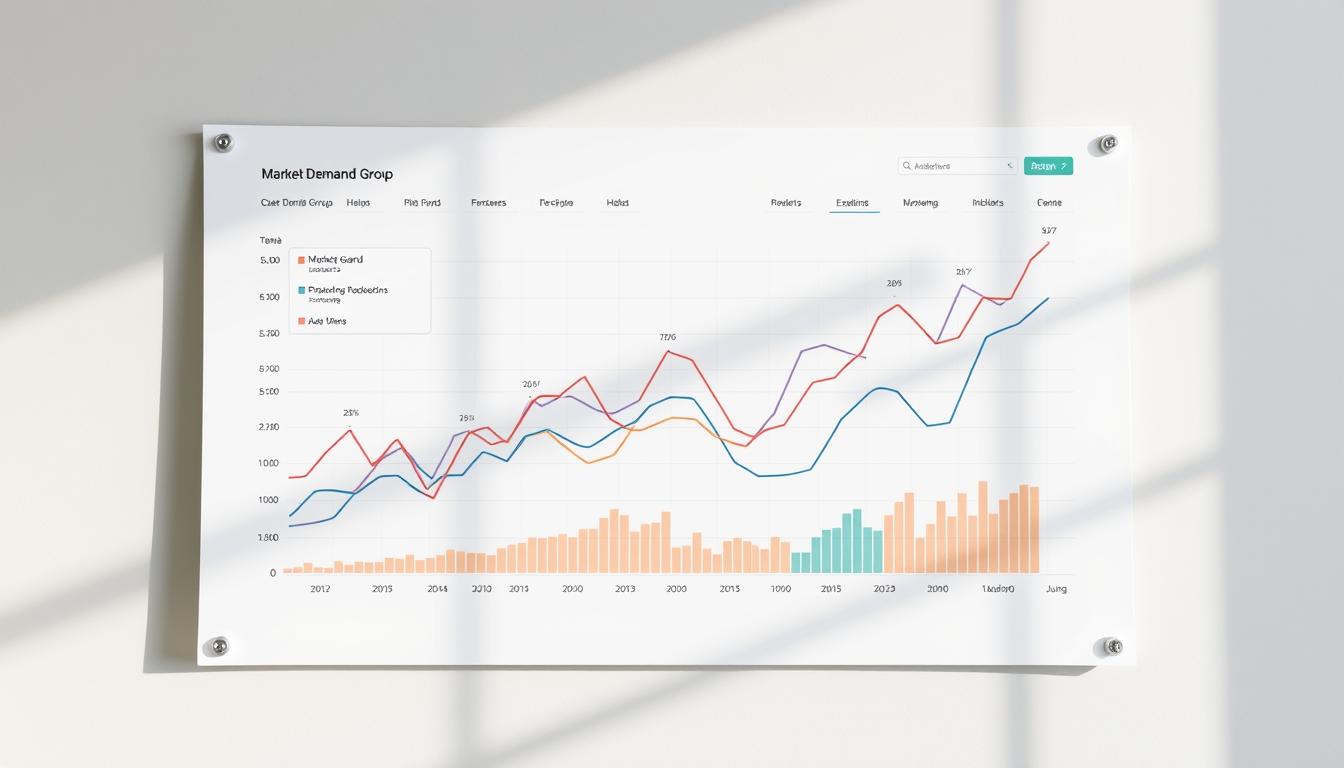
The Dynamics of Market Demand Functions and Curves
How do economic models translate to real-world business decisions? Visualizing buyer behavior through graphs helps companies predict outcomes and adjust strategies. Let’s explore how these tools clarify complex relationships between costs, availability, and consumer actions.
Understanding the Demand Curve
A demand curve shows how price changes affect purchase volumes. When bakery chains lower croissant prices by 10%, sales often rise 15%—proving this inverse relationship. Here’s a simplified demand schedule:
| Price per Unit (€) | Quantity Demanded |
|---|---|
| 50 | 200 |
| 40 | 350 |
| 30 | 550 |
External factors like climate change shift the entire curve. Unusually hot summers in southern France pushed ice cream sales 28% higher—even without price adjustments. This demonstrates how trends reshape buying patterns beyond basic cost considerations.
Interpreting Market Equilibrium
Equilibrium occurs when supply matches consumer needs perfectly. Electric vehicle manufacturers achieved this in 2023 by producing 12,000 units monthly—exactly matching French buyer interest at €35,000/car. Disruptions happen when:
- New competitors enter (supply rises)
- Raw material costs spike (production drops)
- Consumer priorities shift (demand increases)
« Equilibrium isn’t static—it’s a moving target requiring constant calibration. »
Businesses use these models to optimize stock levels and pricing. For instance, adjusting product service bundles during peak seasons maintains balance without sacrificing margins. By tracking these curves, companies turn abstract data into actionable plans.
Real-World Case Studies and Examples

What separates resilient companies from those scrambling during crises? Concrete strategies rooted in consumer behavior analysis. Let’s examine how brands navigated sudden shifts—and what professionals can learn from their wins and missteps.
When Preparation Meets Opportunity
KFC’s 2018 U.K. chicken shortage forced 800+ stores to close temporarily. Their recovery plan? They partnered with logistics firms to create regional supply hubs, cutting restocking time by 48%. Within three months, sales rebounded to 92% of pre-crisis levels.
Parisian bakery chain Pastreez capitalized on individual demand patterns during heatwaves. By offering frozen macaron kits with delivery guarantees, they turned climate change impacts into a 37% revenue boost. “Adaptation isn’t optional—it’s survival,” notes their COO.
Costly Assumptions vs. Data-Driven Wins
A tech startup misread latent demand for budget tablets, overproducing by 120,000 units. Clearance sales eroded margins by 19%. Contrast this with a Lyon beverage company that used climate models to adjust stocks before record-breaking summers. Their proactive approach secured 31% market share gains.
| Strategy | Outcome | Key Lesson |
|---|---|---|
| Dynamic pricing | 22% fewer stockouts | Align costs with real-time demand |
| Product-service bundles | 41% higher retention | Solve multiple customer needs |
| Supplier diversification | 67% faster crisis recovery | Build redundancy into supply chains |
« Every crisis reveals who’s been watching the data—and who’s been winging it. »
These cases prove agility beats guesswork. Whether adjusting menu changes or redesigning product lines, businesses thrive when they treat analysis as daily practice—not just annual reports.
Applying Market Demand Analysis to Business Strategy
How can businesses turn consumer insights into operational wins? Start by synchronizing decisions with real-time buyer signals.
A Lyon-based sportswear company reduced overstock by 41% last year. They achieved this by adjusting production cycles using social media trend data and weather forecasts. This approach shows how strategic alignment drives efficiency.
Optimizing Production and Pricing Strategies
Match manufacturing output to sales patterns using these steps:
- Analyze monthly search volumes for product categories
- Track competitor discount cycles through price monitoring tools
- Set flexible inventory thresholds based on seasonal indexes
Consider this pricing strategy comparison from French retail data:
| Approach | Margin Impact | Customer Retention |
|---|---|---|
| Dynamic Pricing | +18% | 67% |
| Cost-Plus Model | +9% | 52% |
« Pricing isn’t about covering costs—it’s about capturing perceived value at the right moment. »
Aligning Marketing Efforts with Consumer Trends
A Parisian skincare brand boosted conversions by 29% using Instagram sentiment analysis. They shifted ad budgets toward hydration-focused products during heatwaves, matching real-time buyer concerns.
Three steps to synchronize campaigns:
- Map keyword trends to content calendars
- Align promo timing with regional events
- Test messaging variants weekly
Balance data with flexibility. When a Marseille beverage company noticed 31% higher weekend searches for « non-alcoholic cocktails, » they launched Friday email blasts featuring new recipes. Result? A 19% sales lift in under six weeks.
Conclusion
What separates thriving enterprises from those constantly firefighting? The answer lies in mastering consumer behavior patterns. Through real-world examples like KFC’s supply chain overhaul and Lyon’s sportswear production adjustments, we’ve seen how data-driven decisions prevent costly mismatches between availability and needs.
Successful businesses treat analysis as daily practice—not annual rituals. Tools like social listening and demand curves help predict buying shifts before they impact stocks or revenue. When 68% of French households changed purchasing habits during recent heatwaves, agile brands adapted packaging and delivery within weeks.
Three principles ensure stability:
- Align production cycles with verified search trends
- Balance pricing strategies with regional income levels
- Monitor substitute goods that influence customer choices
Ignoring these steps risks overstocking products or missing seasonal surges. Remember: your brand reputation hinges on meeting expectations consistently. Start small—test one analytical method this quarter, then scale what works.
With the right approach, you’ll transform volatility into opportunities. Ready to build resilience? Your next strategic move begins today.

